
The Explore page lets you:
- View events that occurred during a specified timeframe.
- Mute and acknowledge events.
- View vital event details.
- Use filters to explore specific meters and conditions.
- Export and manage reports.
TIP: Click the number of Active Events on the Catalog page to jump to those events or accounts on the Explore page.
___________________________________________________________________________
About Events
Events are user-definable conditions that when met become active events. When the conditions are no longer met, the event has ended.
Events apply to network meters.
___________________________________________________________________________

To get started, use the Active Events drop-down menu to select one of:
- Active events – Events that are still active during the selected timeframe.
- Ended events – Events that ended during the selected timeframe.
- All events – Selects both active and ended events that fall within the selected timeframe.
- Group by Endpoint SN – Organizes results based on the serial numbers of the affected endpoints.
Use the timeframe drop-down menu to choose one of the available timeframes. By default, Last 72 Hours is selected.

Click-drag the vertical bar to scroll up and down and see more time periods.
If you know the name of the event of interest, type it into the search box and press Enter.
TIP: If you do not find what you are looking for, adjust the timeframe.
Use the Select Events drop-down menu to choose an event of interest.

NOTE: The events shown above are examples. The list of available events is based on user-defined events and differs with each utility.
To add logic to your search results, do the following:
-
- Click + Add Filter – focus the search on a specific set of meters. Notice the available fields are arranged by account, endpoint, event, location, meter, and service values.
TIP: To quickly find a field of interest, start typing its name. BEACON looks ahead to find matching fields. So, for example, type Sta to quickly find the Status field. - Use the Operator drop-down menu select logic that you want to apply to your search. Note that the available operators are based on the selected field.
- Click + Add Filter – focus the search on a specific set of meters. Notice the available fields are arranged by account, endpoint, event, location, meter, and service values.
Operators for Fields that contain Numbers and Fields that contain Dates
| Operator | Function |
| Exists | Use this operator to filter for the existence of a field when a large set of exceptions and events. |
| Does Not Exist | Use this operator to find instances that do not match an existing condition. |
| Is Between | The value falls between two values. |
| Is Not Between | The value does not fall between two values. |
| Less Than | The value is less than the provided value. |
| Greater Than | The value is greater than the provided value. |
| Less Than Or Equal | The value matches or is less than the provided value. |
| Greater Than Or Equal | The value matches or is greater than the provided value. |
Operators for Fields that Contain Text
| Is One Of | The value matches one of the values provided. |
| Is Not One Of | The value does not match one of the values provided. |
| Exists | Use this operator to find an existing condition when searching a large set of exceptions and events. |
| Does Not Exist | Use this operator to find instances that do not match an existing condition. |
- When finished click Save.
- Repeat steps 1 – 3 to further refine your search.
Selected Events are displayed next to the Selected Event drop-down menu.
![]()
The Event Table displays the following information:
| Column Name | Function |
| Event Name | Indicates the name of the conditions that created the event. |
| Endpoint SN Meter ID Account ID |
Unique Identifiers. Click the icon next to an endpoint serial number to jump to the Monitor page and view the corresponding meter card and consumption details. |
| Account Name | Full name of the account holder as passed to BEACON via Data Exchange file. |
| Address | Location address of the event. |
| Start Date | Date the event began. |
| Duration | Length of time during which the event was active. |
| Event Status | Active – Ongoing event. Ended – Stopped. |
Click Show Chart/Hide Chart to view or hide a chart of the selected event. This example shows a chart of active Reverse Flow events per day.

To expand an event card, click the + next to an event name. The example below shows an expanded card for a user-defined event called “Reverse Flow.” Notice the card includes Account, Endpoint, Event, Location, Meter, and Service tabs that when selected display details.

The Event tab displays additional details that differ based on the type of event. The following table describes the available fields.
| Field Name | Function |
| Duration | Length of time the event was active. |
| Event Status | Active – Ongoing event. Ended – Stopped event. |
| Flow Rate | Total flow volume divided by the duration of the event. |
| ID | 16-character unique identifier of the event. |
| Maximum Flow Rate | The largest flow rate calculated between two consecutive reads while the event was active. |
| Minimum Flow Rate | The lowest flow rate calculated between two consecutive reads while the event was active. |
| Time Created |
Date and time at which the event started in the meter timezone. |
| Time Last Active | Date/timestamp the event was last updated by BEACON. |
| Time Last Received | Date/timestamp of the last endpoint communication. |
| Time Last Updated | Date/timestamp of of the last event update. |
| Time Started | Date/timestamp of when the event became active. |
| Total Flow | Volume of water consumed during the event duration. |
| Raw Event Document | Click the triangle to get a breakdown of the event details in JSON format, used for troubleshooting. |
Click the up/down arrows (circled in red below) next to a given field in the table to toggle the sort order from ascending to descending and vice versa.

Click the More Actions (three dot) menu to do one of:
- Mute/Unmute – Hide/unhide the corresponding event and stop notifications. When an event is muted, the More Actions menu gives you the option to unmute the event.
- Acknowledge – Pause notifications until a selected end date. After the end date, notifications resume and the event remains hidden. NOTE: End dates cannot be set to today or be in the past.
 When Acknowledgements expire, the system displays a banner with a Review Now button.

Click Review Now to see a color-coded list of expired events sorted by expiration date.
Red – Event expired.
Orange – Event expires in 72 hours or sooner.
Green – Acknowledged event expires in more than 72 hours.
Right-click any event name to:
• Filter – Add a filter via the Selected Events drop-down menu:

• Copy – Save the event name to your computer clipboard.
- History – Open a drawer to see the mute and acknowledge history of the event.


Use the Mute and Acknowledge located above the Events List (shown below) to filter results based on whether the events have been muted, acknowledged, or both.

In the example above, a single Acknowledged event is displayed and the More Actions menu has been selected.
Use the pagination controls under the table to step backward and forward through the results and to jump to specific pages of the results.

Saved Reports
Click Saved Reports to view and manage custom-created reports.
![]()
Use the drop-down menu to filter results based on whether the report is public (available to everyone) or private (available only to the person who created it).
To quickly find a specific report, type all or part of its name in the search field to return matching results.

Click the up/down arrows next to a given field in the table to toggle the sort order from ascending to descending and vice versa.
Click the More Actions (three dot) menu to do one of:
Delete – Remove the report.
Edit Report – modify the report
Make Private – Hide the report from everyone but its creator.
Copy – Duplicate the report. This is helpful for making new reports based on an existing report.
Copy Link – Create a sharable link to a report.
Take Ownership – Required to make changes to a report you did not create.
Use the pagination controls under the table to step backward and forward through the results.
Export
From the Export drawer Export Data section, you can see an overview of the Event and select fields to include in the export.

TIP: If desired, check the boxes to include Acknowledged and Muted events in your exports. We also recommend including the Event Name in such exports.

Click Hide Export Options to toggle the field list open and closed.
Use the Select Fieldset drop-down menu to select by:
Exceptions – Fieldsets related to meter or system exceptions, including the Exception field that identifies alert or error conditions.
Flow – Fieldsets related to water usage and flow characteristics, including Unit of Measure, Flow Rate, and Meter Size.
Sensors – Fieldsets related to sensor readings, including Value, Minimum Value, Maximum Value, and Unit of Measure.
Type all or part of its name in the Search Fields box to return matching results.
TIP: To jump to fields that contain IDs: Type ‘id.’
Type ‘sn’ to select the Endpoint or Meter serial number fields
Type ‘date’ to select date related fields: Endpoint Install Date, Current Leak Start Date, Meter Install Date, and Service Agreement Start Date.
TIP: When selecting fields to include in an export, the order in which you check each box determines the order of the fields in the resulting CSV file. You can change this order when you edit the fieldset.
The Export drawer Events Fieldsets section lets you manage – view, create, edit, and delete – event fieldsets.

TIP: Hover your cursor over the fieldset list to scroll and view more entries. The list displays six fieldsets at a time but can show 10, 20, 50, or 100 per page as determined by the pagination controls beneath the list.
Use the pagination controls under the Fieldset list to step backward and forward through the results.
Use the search box to find fieldsets by their name.
Click +Create Fieldset to customize event fieldsets that include your choice of fields in the order you want them in. You can also give those event fieldsets a meaningful name, and set their format to delimited (CSV) or fixed width (Format C).
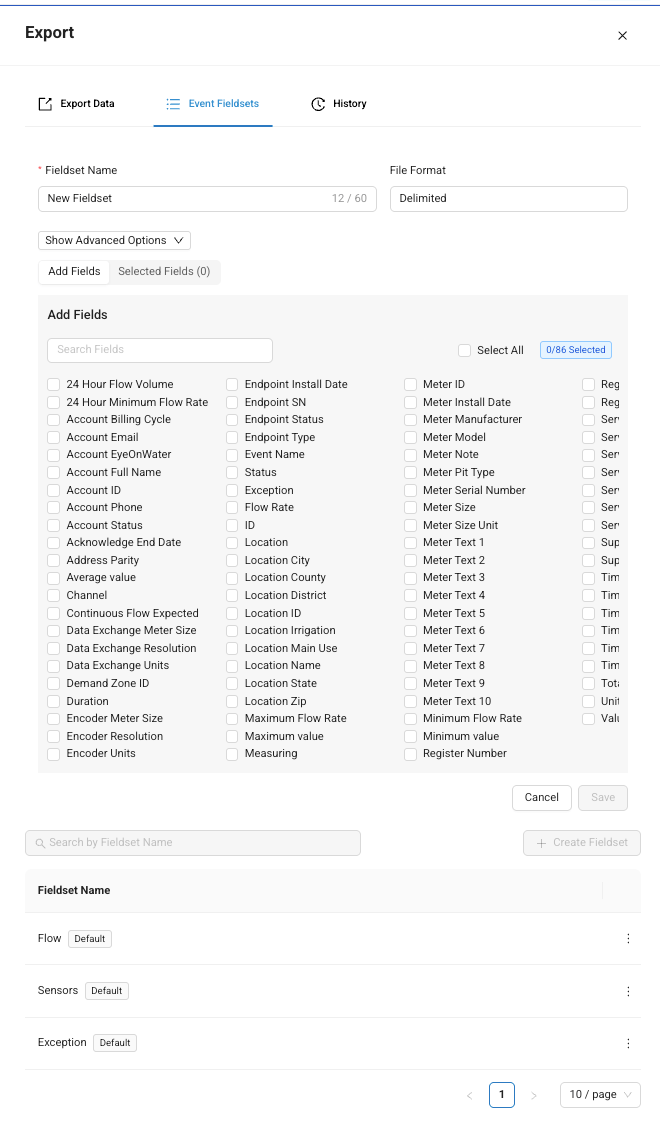
The Fieldset Name field is required and lets you enter a meaningful name for your file.

Expand the Show Advanced Options menu to:
- Make the fieldset Private (leave the Is Public box unchecked) or Public (check the Is Public box).
- Toggle Header Visibility on and off.
- Set the current custom fieldset as a default. Check Is Default to open the Set Default Type drop-down menu and choose the desired fieldset type.

- The File Format drop-down menu lets you change the file extension.

NOTE: All fieldsets have system-defined defaults that get replaced by user-defined defaults when the Make Default Fieldset function is used.
• Use the Encoding drop-down menu to choose an encoding format.
- Change the file extension from the .csv to any desired extension by typing, for example, .txt or .dat. NOTE: While the extension will be changed, the export file format remains CSV.
- Use the Field Separator drop-down menu to choose one of: coma (,), colon (:), pipe (|), semi-colon (;), or tilda (~) as a delimiter.
- Use the Line End drop-down menu to choose Windows or Unix-friendly line endings.
- Use the File End drop-down menu to choose to end a file with Nothing or a New Line.
- Use the Quoting Option drop-down menu to choose one of All, Minimal or None.
Use the Add Fields tab to select the fields to include in your events export.
TIP: When selecting fields to include in an export, the order in which you check each box determines the order of the fields in the resulting CSV file. You can change this order when you edit the fieldset.
Use the Selected Fields (x) tab to see your selections in the order the fields were selected in. The grip handle lets you drag and drop each field to change the field order in your export.
Click Save to store the current fieldset or click Cancel to discard it.
The lower portion of the drawer displays a list of fieldsets along with a search box and pagination controls. Use the More Actions option to edit or delete any given fieldset. See Export > Events Fieldsets <jump link to the previous section> for details.


